





Privacy Settings
We use cookies on our website to make it easier for you to use and continually improve it (technically necessary or essential cookies). Furthermore, we use cookies to provide you with content from other websites (e.g., YouTube), analyze access to our website, and improve our offers and products (non-essential cookies/functional cookies). You decide which cookies you allow and/or reject. You can change your selection at any time in the cookie settings. Additional information can be found in our Privacy Policy.
Privacy Settings
Cookie Settings
Cookies necessary for the correct operation of the site are always enabled.
Other cookies are configurable.
Essential cookies
Always On. These cookies are essential so that you can use the website and use its functions. They cannot be turned off. They're set in response to requests made by you, such as setting your privacy preferences, logging in or filling in forms.
Analytics cookies
Disabled
These cookies collect information to help us understand how our Websites are being used or how effective our marketing campaigns are, or to help us customise our Websites for you. See a list of the analytics cookies we use here.
Advertising cookies
Disabled
These cookies provide advertising companies with information about your online activity to help them deliver more relevant online advertising to you or to limit how many times you see an ad. This information may be shared with other advertising companies. See a list of the advertising cookies we use here.

Screen land for wind, solar and batteries across Spain in minutes

WindSense puts the wind resource, grid connection capacity by substation, environmental zoning, cadastre and an hourly-price financial model on one map. Built for small developers, consultancies and real estate agencies handling rural land in Spain.

Real estate agency with rural land? See the Agency plan: renewable potential map, AI land search and owner tracking, from €99/month.

Listed in the NDC Partnership Climate Toolbox. Developed in Girona, Spain, by Terra Eolica Soluciones S.L.

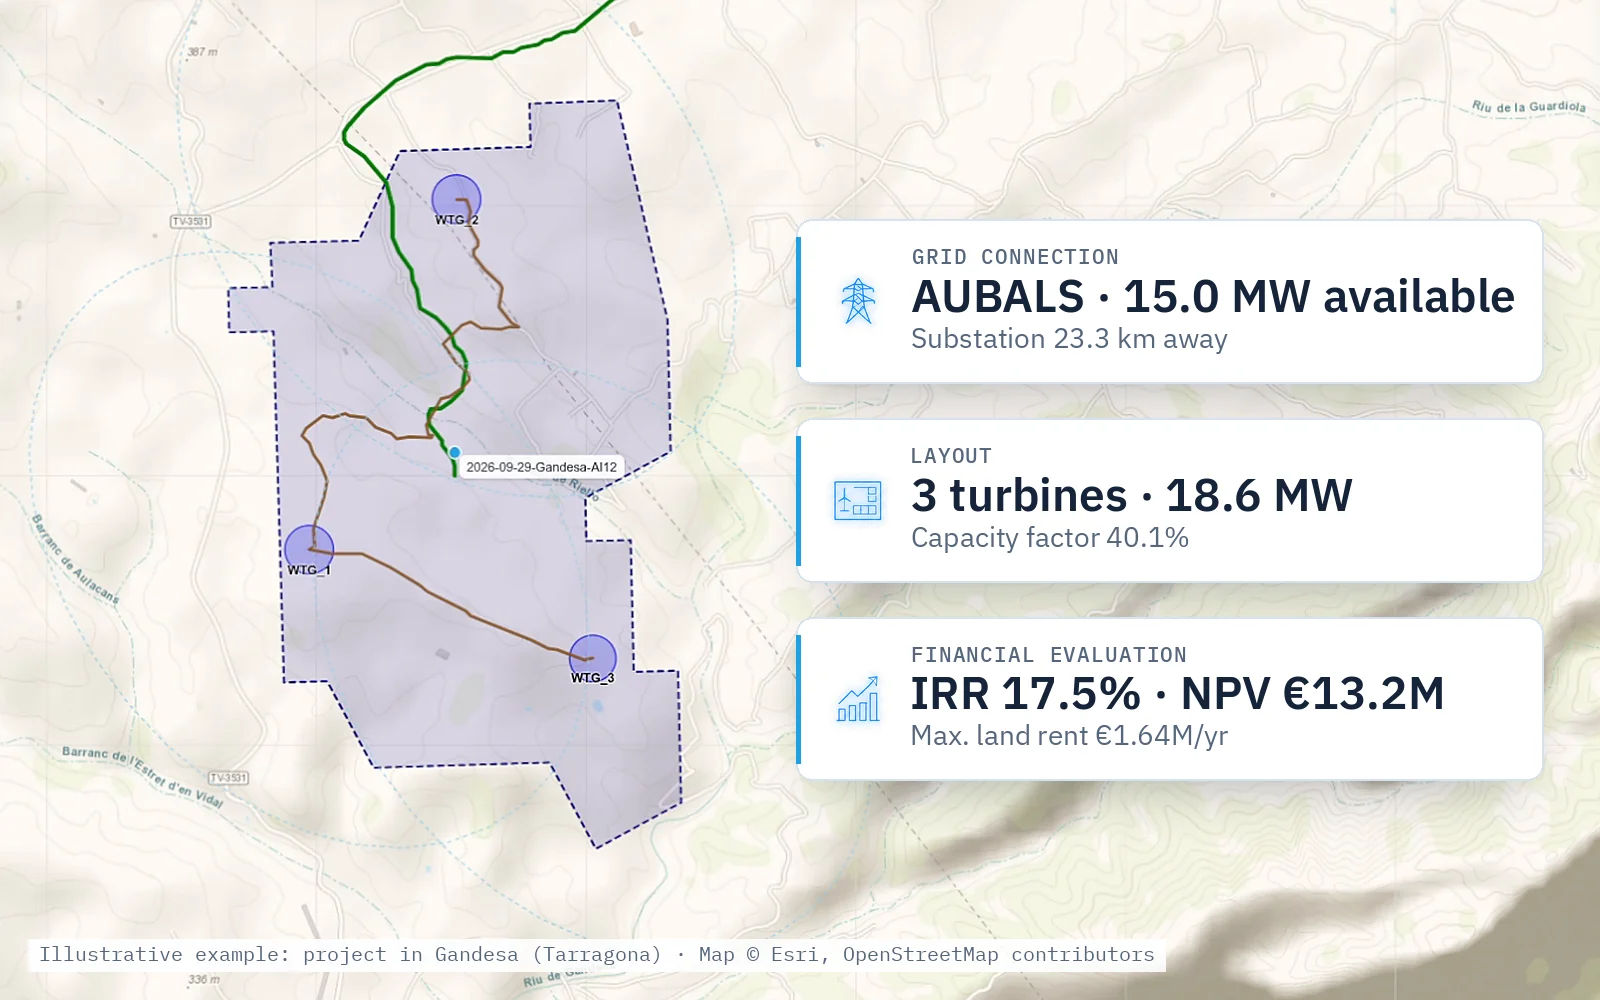
WindSense: financial evaluation of a wind farm with five turbines and their internal cable network on the map, with CAPEX, OPEX, hourly day-ahead prices and grid connection cost
  1. 1Site selection
  2. 2Grid connection
  3. 3Layout
  4. 4Financial evaluation
  5. 5Reporting
  6. 6Land parcels

One platform for the whole early stage

Wind, solar PV, hybrids and battery (BESS) configurations, from area pre-screening to the investor-ready report.

Wind
Solar PV
Hybrids + BESS
GIS
Layout
Grid intelligence
Financial modelling
Cadastre

Who WindSense is for

Developers and consultancies with small teams

Today they overlay layers in QGIS and model in Excel: every new site means hours of downloading, reprojecting and cleaning data before anyone knows whether it is worth pursuing. WindSense does that screening in minutes and leaves the detailed work to the tools you already use: export the site and the layout as KML and carry on in QGIS or windPRO.

See how it works

Real estate agencies with rural land

A developer does not call about a plot "with plenty of sun". They call about a plot with a substation that still has capacity a few kilometres away, no protected area on top of it and a good resource. WindSense gives you the map to find those plots, check them in one click and manage the relationship with each owner through to the agreement.

See the offer for agencies

For real estate agencies: find, assess and manage land for renewables

Know which rural plots a developer wants, find them before others do and run the negotiation with each owner. No GIS to install, no technician to hire.

A map with what developers look at

Environmental zoning, PV sensitivity index, protected landscapes and aeronautical easements; prospective areas; power lines by voltage and substations with their available connection capacity, updated every month.

Your layers on the same map

Load your own data: GeoJSON, KML/KMZ, GPX, Shapefile, GeoTIFF, CSV with coordinates or WKT, WMS/WMTS and WFS services, and XYZ tiles.

AI land search

Set the criteria — constraints, wind or sun, terrain, free substation capacity, minimum area — and WindSense marks the areas that meet them on the map.

Cadastre and express check

Load the cadastral data of each parcel — reference, land use, area and boundary — and check it in one click: resource, distance to grid, environmental sensitivity and landscape, each value next to its suitability threshold.

Tracking every owner

Per plot: owner, negotiation stage, contacts made, agreements and next steps. See at a glance where each owner stands.

Reports per plot and per negotiation

A report for each plot, to show the owner or the buyer, and a status report on all your negotiations for your team.

Your plots and your owners stay yours

Plots, owners and contact history are stored in a database on your computer, not on our servers, with backups to your own Google Drive. We do not contact your owners or your buyers without you. If you publish a plot in our land portfolio and the buyer or tenant comes through our network, we split your fee 50/50; the owner pays nothing extra.

Try it on your own portfolio: send us 10 cadastral references and we will tell you which are suitable for wind or solar and, if not, why. Free. Your references are not shared or used to contact owners.

How it works: from a click on the map to a report

For developers and consultancies: six stages, in the order a project is actually developed. Each one saves its result to the project and feeds the next.

1. Site selection

Draw the polygon, or let the AI search find it

Define the area by hand over the environmental sensitivity index, or run the AI-assisted search: set the technology, minimum area, maximum distance to grid and target capacity factor, and WindSense returns candidate zones with their estimated capacity in MW. One click on a result turns it into a project.
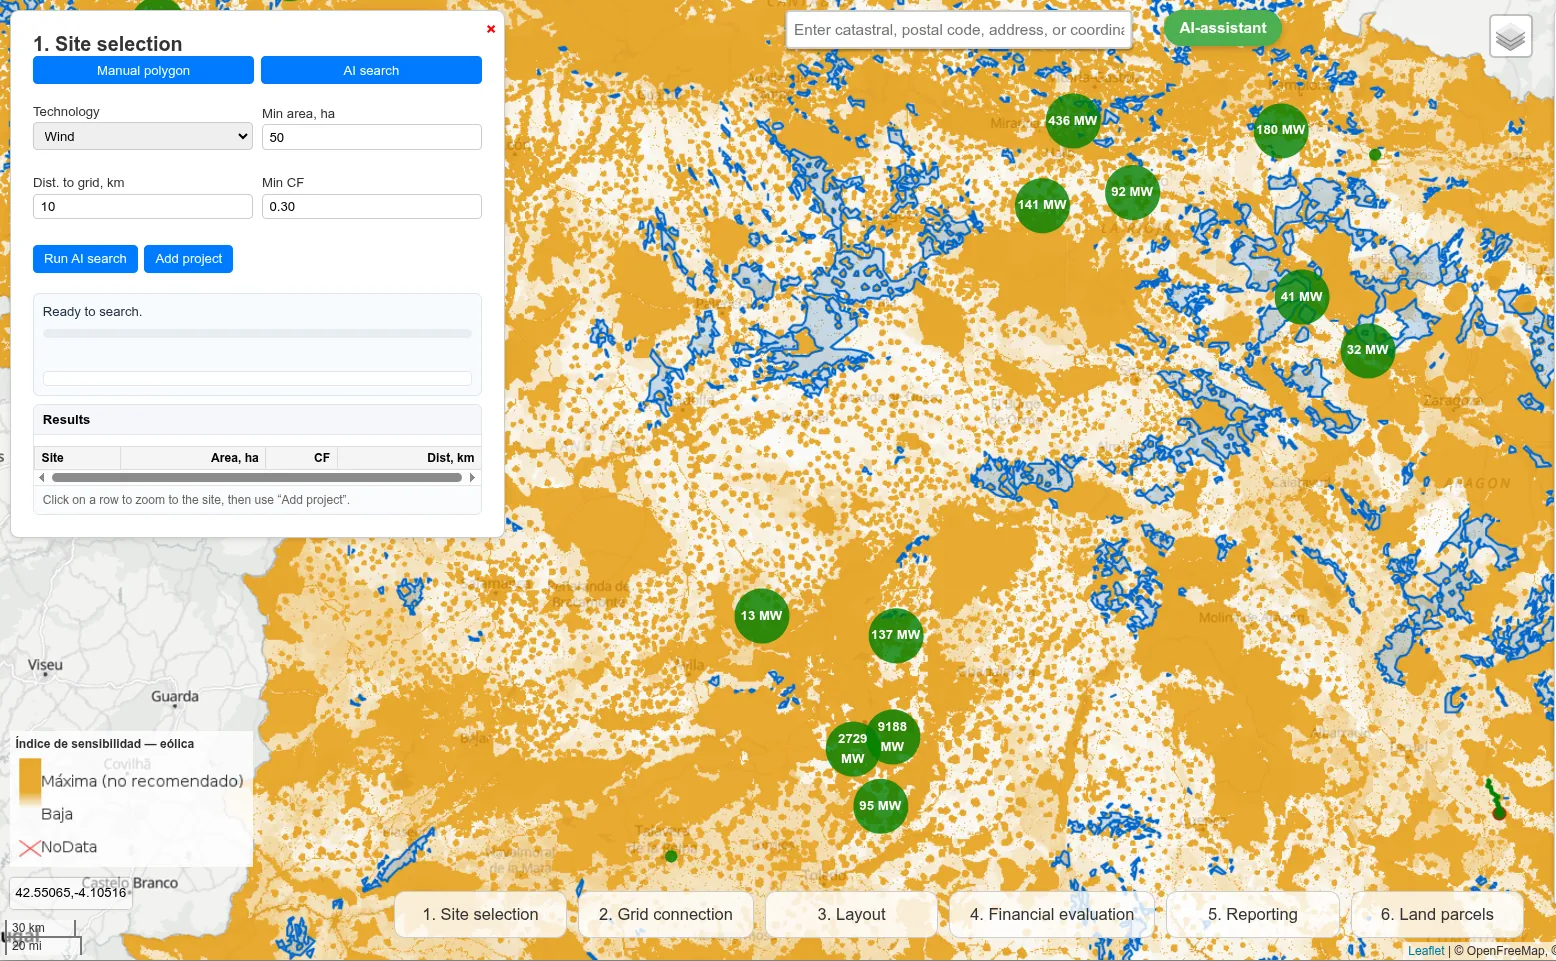
AI-assisted wind site search in WindSense over the environmental sensitivity index: candidate zones marked on the map with their estimated capacity in MW
2. Grid connection

Substations with capacity, the evacuation route and its cost

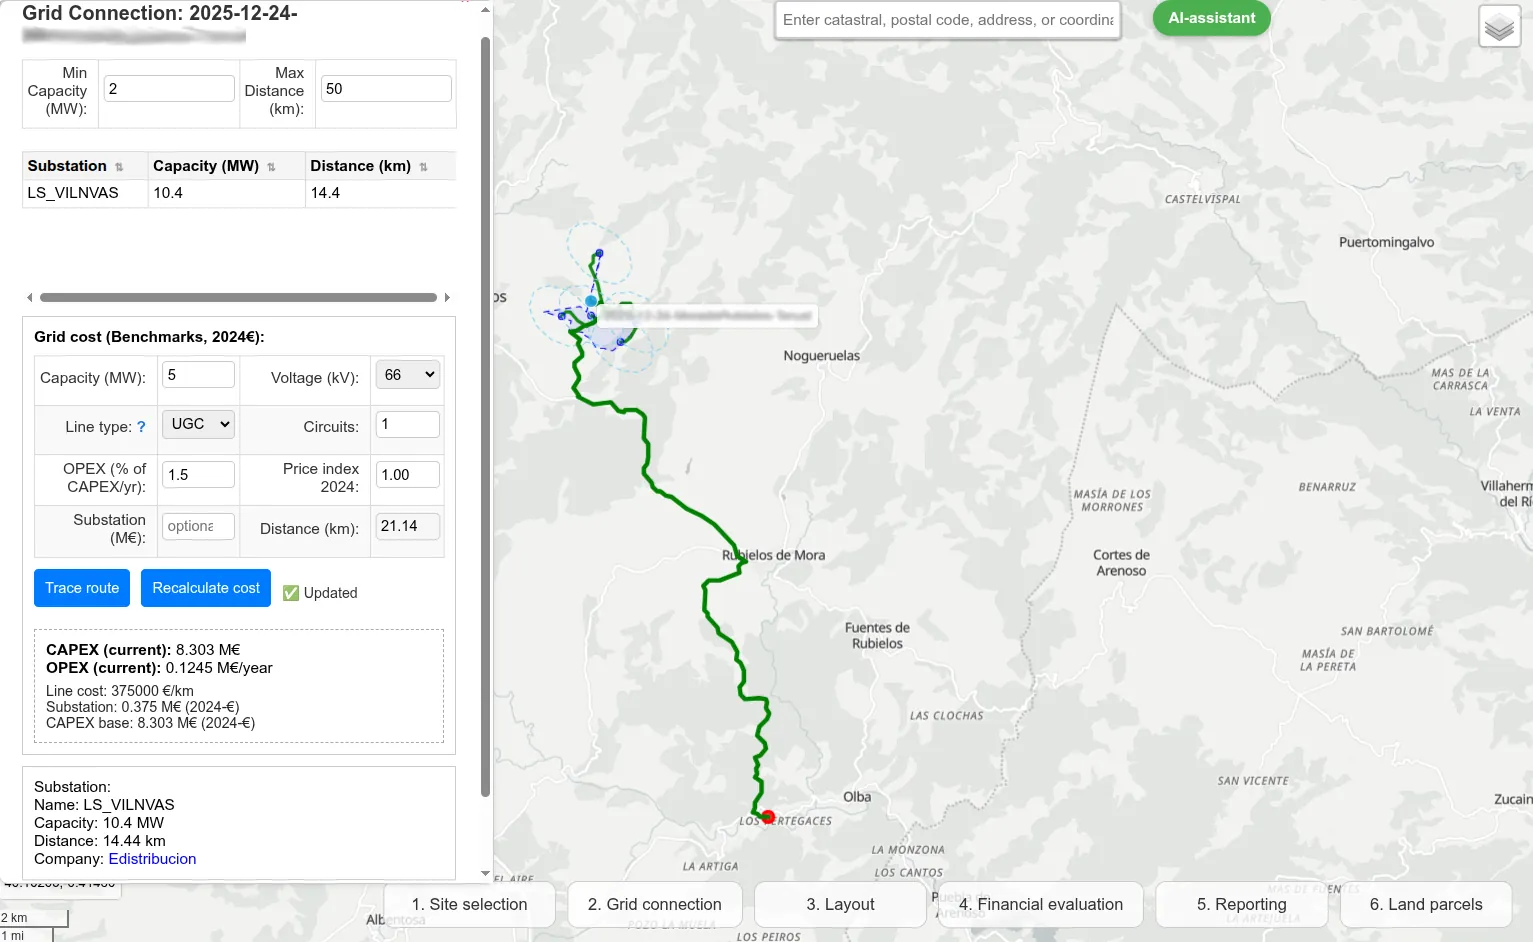
Set a minimum capacity and a search radius: WindSense lists the substations around the site with their available connection capacity in MW and the distance to the land. Pick one and the system traces the evacuation line route and estimates its CAPEX and OPEX from benchmark costs by voltage, line type and circuits, substation included.

Grid connection in WindSense: substation with available capacity, a 21 km evacuation route traced on the map and the estimated cost of line and substation
3. Layout

Turbines or modules placed, with setbacks and internal roads

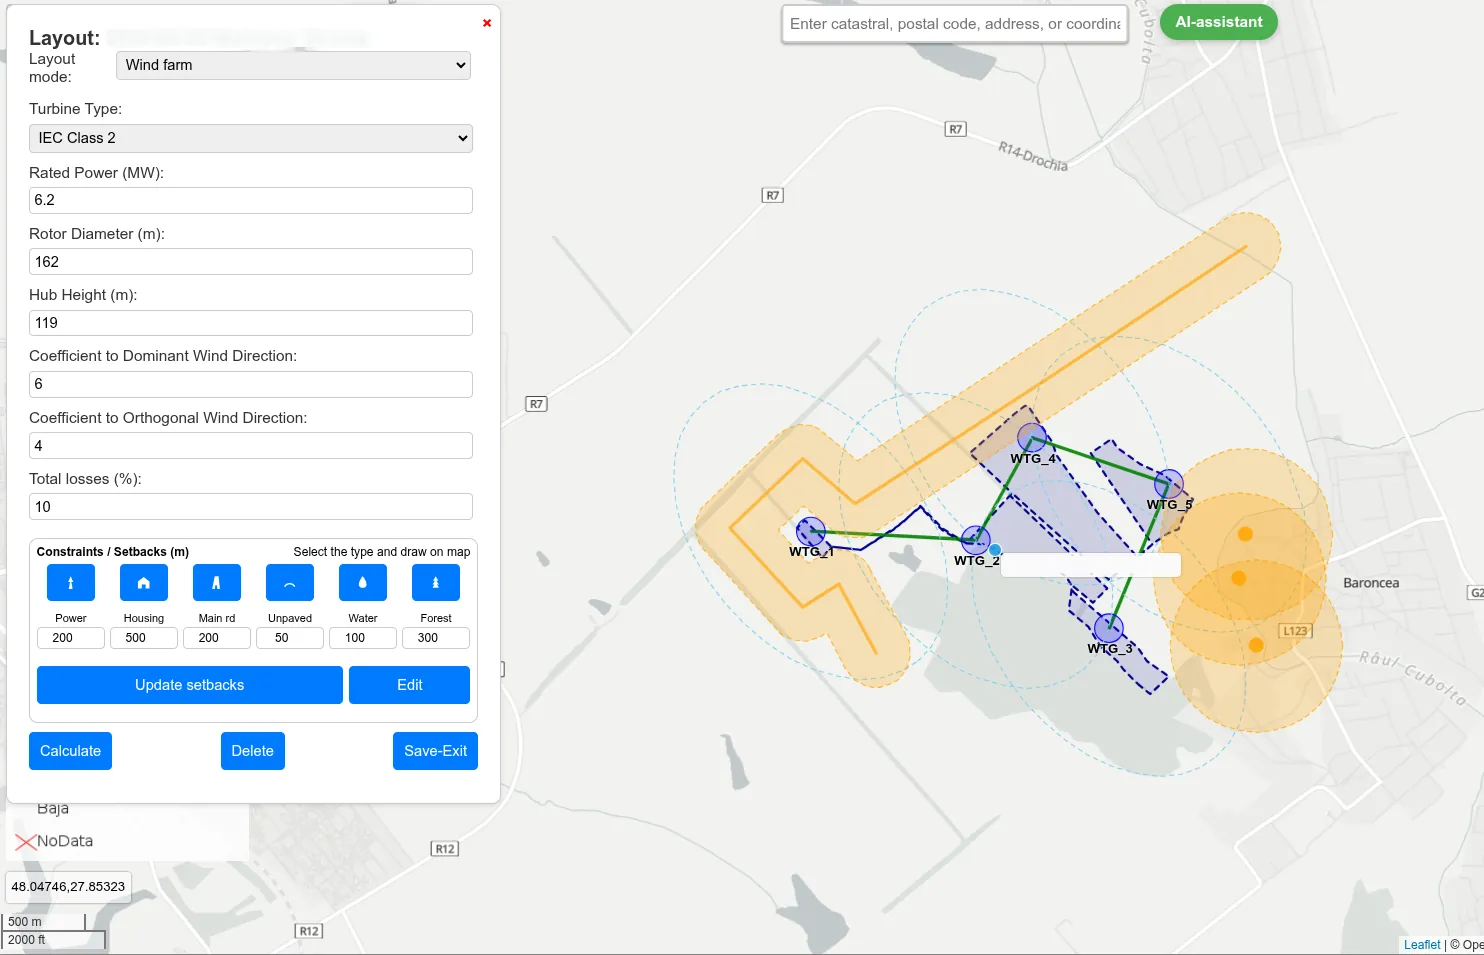
Choose IEC class, rated power, rotor diameter and hub height. WindSense places the turbines according to the dominant wind direction and respects the setbacks you draw: power lines, housing, roads, water and forest. It calculates installed capacity, net annual production, capacity factor and the kilometres of access roads and cable trenches. For PV, module rows at their optimal tilt.

Wind farm layout in WindSense: five turbines with their internal cable network and the setback zones around roads and housing shaded on the map
4. Financial evaluation

LCOE, IRR, NPV and the maximum rent the project can pay for the land

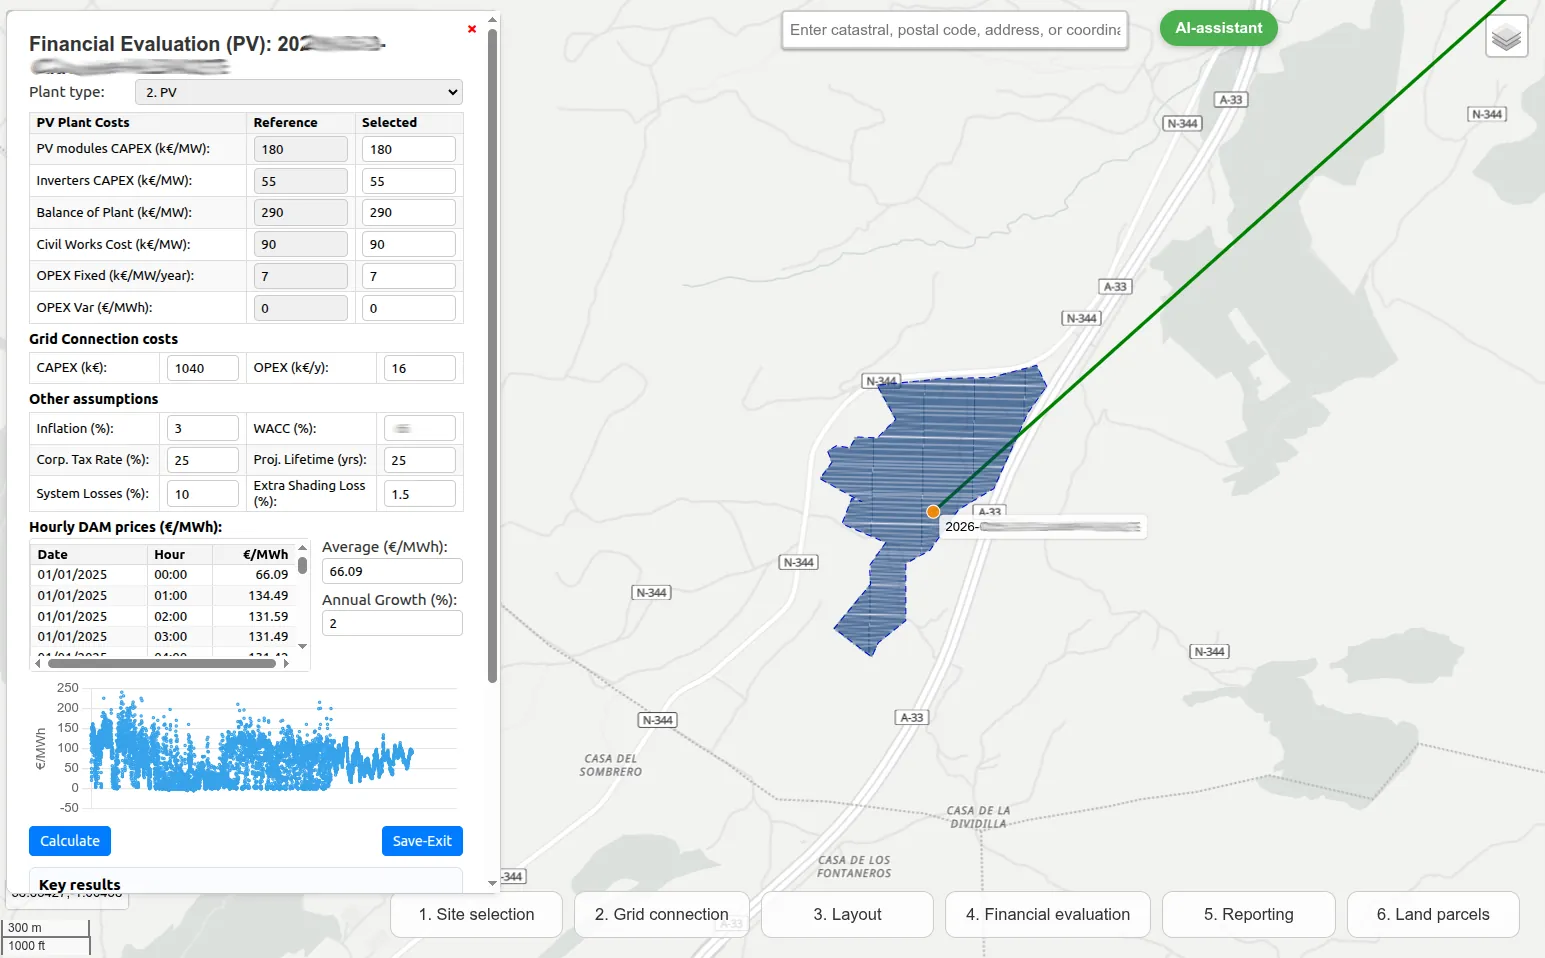
For wind, PV, hybrids and BESS: start from reference CAPEX and OPEX and edit them, add the grid connection cost, inflation, WACC and corporate tax. Hourly production is matched against hourly day-ahead market prices. The output includes the figure that matters most to landowners and developers alike: the maximum annual land rent the project can support.

Financial evaluation of a PV plant in WindSense: itemised CAPEX, grid connection cost, hourly day-ahead prices and the plant with its evacuation line on the map
5. Reporting

Financial report, drawings and EIA structure

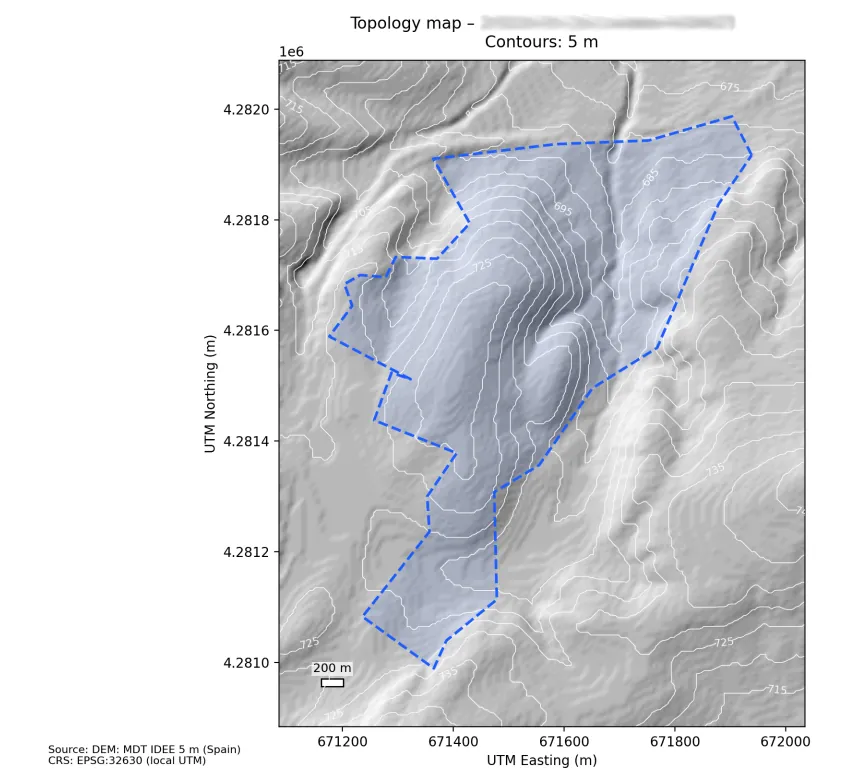
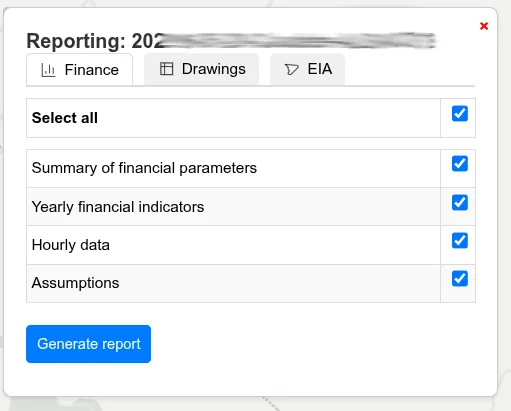
Generate module by module: the financial summary with yearly indicators, hourly series and assumptions, in spreadsheet format; the PDF drawings — location, general layout, topography with 5 m contour lines from the national DEM, alternative sites and alternative grid routes —; and the outline of the environmental impact assessment with the inventory of impacts to analyse.

Topographic drawing generated by WindSense: site boundary over 5 m contour lines from the Spanish national DEM, in UTM coordinates
WindSense reporting module with finance, drawings and EIA tabs and content selection before generating the report
6. Land parcels

The project's plots, with cadastre and title requests from the map

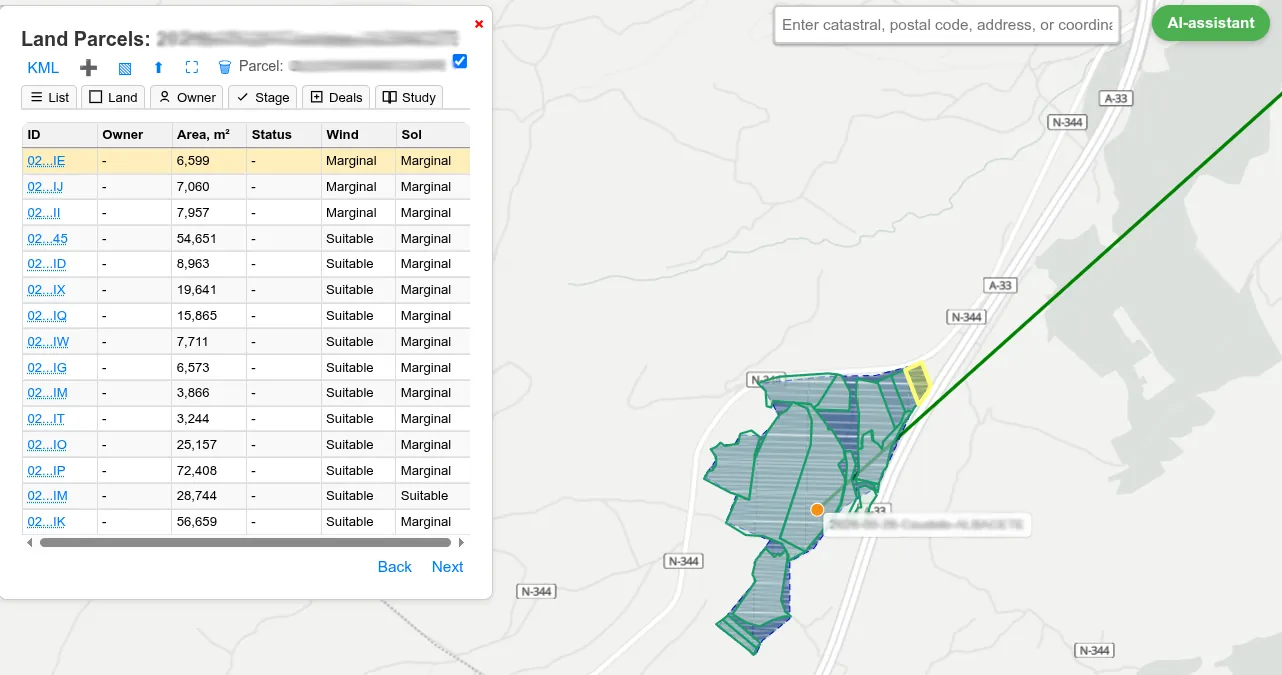
Manage the parcels of each project: owner, area, negotiation stage, deals, and the wind and solar suitability of each plot. Look up the cadastral reference, main use and area, load KML boundaries, and request the land registry extract (nota simple) without leaving the map.

Parcel management in WindSense: list of a project's plots with area, status and wind and solar suitability, with the cadastral boundaries drawn on the map

From the first click to the project card

Express evaluation at any point

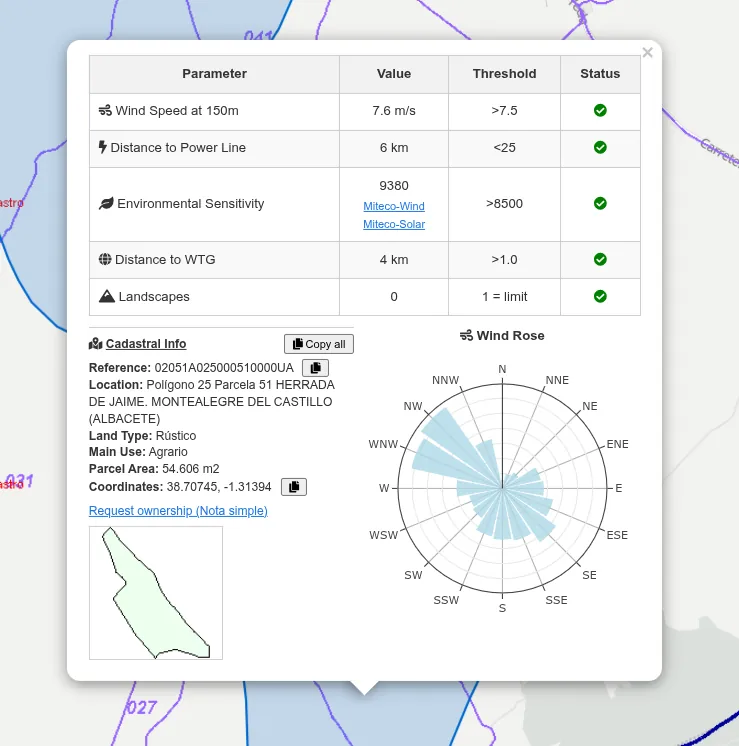
One click on the map returns the exclusion criteria with their thresholds: wind at 150 m, distance to the power line, environmental sensitivity, existing turbines and landscape, together with the plot's cadastral card and its wind rose. It is the same evaluation you can try today on the free map, no sign-up. The built-in AI assistant also answers questions about project parameters right on the map.

WindSense express evaluation: wind at 150 m, distance to power line, environmental sensitivity, distance to turbines and landscape with their thresholds, plus cadastral card and wind rose

The whole project in one panel

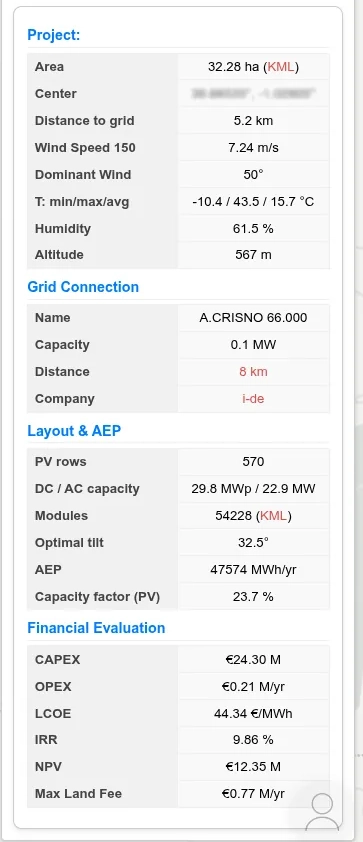
Every project keeps its results card: area and wind, substation with capacity and distance, layout with annual production and capacity factor, and the full financial evaluation — CAPEX, OPEX, LCOE, IRR, NPV and maximum land rent. Exportable and importable to share with the team.

WindSense project card: area, wind, grid connection, layout with annual production, and financial evaluation with CAPEX, LCOE, IRR, NPV and maximum land rent
Exclusive layer

Large electricity consumers near the site

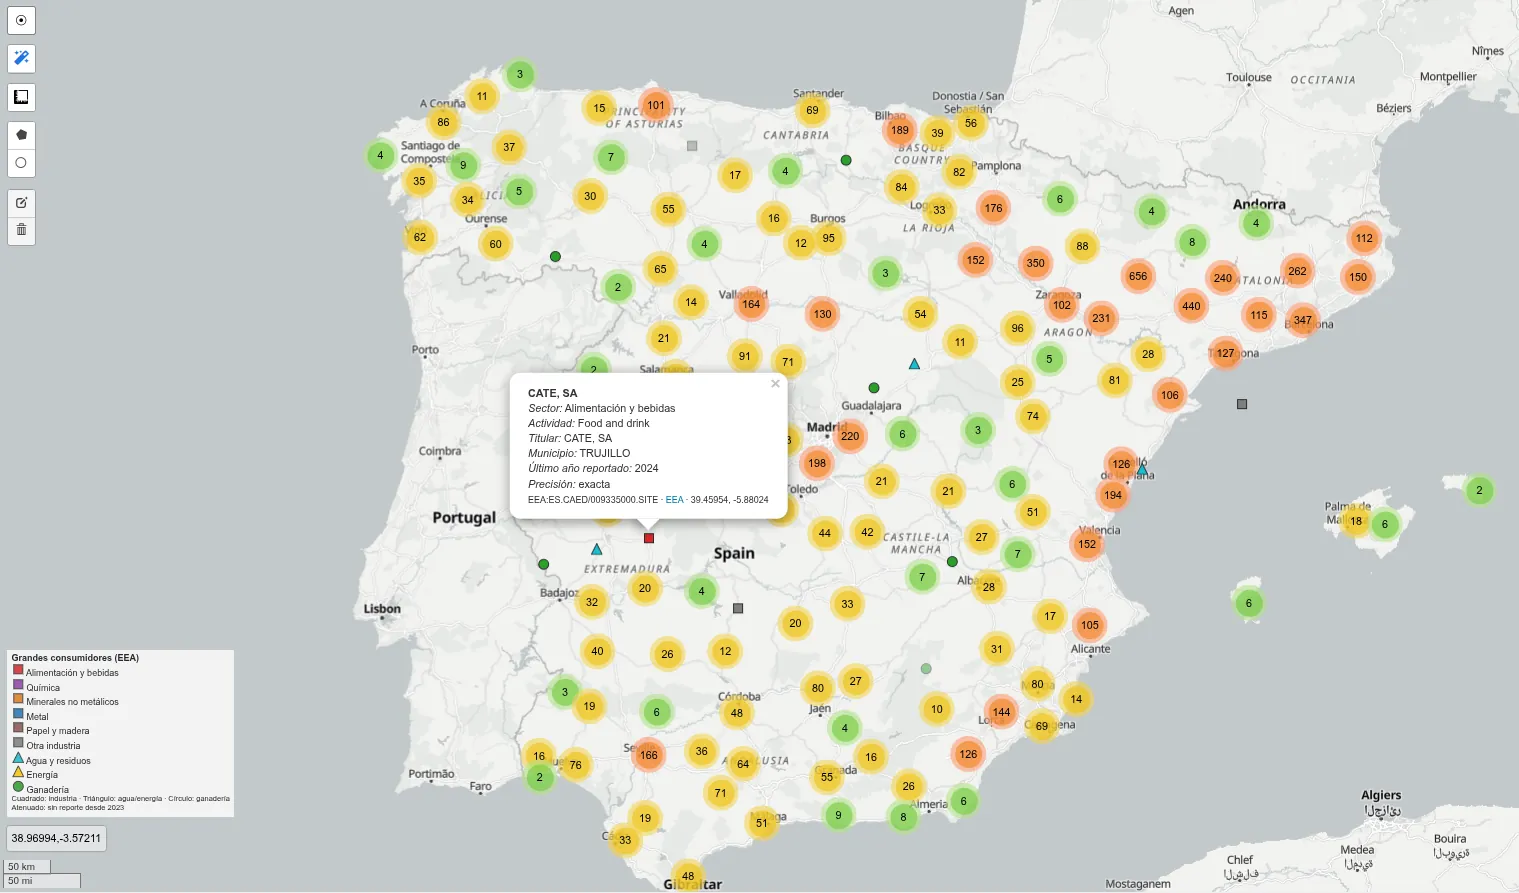
When the substation has no capacity left, the alternative is selling the energy to a nearby consumer: a direct line or a PPA. WindSense includes a layer of large industrial consumers built from the European EEA registry, classified by sector — food, chemicals, minerals, metals, paper, water and energy, livestock — with operator, municipality and last reported year. See at a glance who consumes power a few kilometres from your site.

WindSense layer of large electricity consumers on the map of Spain: industrial facilities from the EEA registry grouped by sector, with the card of a food plant in Trujillo

Works with QGIS and Excel, does not replace them

WindSense is the screening layer. Its output goes straight into the workflow you already have.

KML for sites and layouts

Download the boundary and the turbine positions and open them in QGIS, Google Earth or windPRO for detailed analysis.

Results for your spreadsheet

Hourly production and price series, yearly indicators and the assumptions behind the financial report, ready to check against your own model.

One map for the whole team

Colleagues who do not use QGIS see the same layers and the same projects, with nothing to install.

A new site: QGIS and Excel versus WindSense

TaskWith QGIS and ExcelWith WindSense
Gather layers: MITECO zoning, cadastre, lines and substationsDownload, reproject and clean each sourceLoaded and ready on the map
Connection capacity by substationCheck the maps of REE and of each distribution companyTable by distance and available MW
Layout and yieldOwn calculation or separate toolAutomatic placement, net yield and capacity factor
FinancialsOwn template with an average priceLCOE, IRR, NPV and maximum land rent with hourly prices
Report for the client or the landownerAssembled by handPDF and spreadsheet generated from the project

Layers and data included

Official public sources, integrated and projected: MITECO, Red Eléctrica and distribution companies, Cadastre, OMIE, EEA and OpenStreetMap.

Wind resource and climate

  • Wind speed at 150 m
  • Dominant direction at 150 m
  • Wind rose per point
  • Temperature, humidity and altitude

Power grid and demand

  • 1–66, 66, 110, 132, 220 and 400 kV lines
  • Substations and available connection capacity (MW), updated monthly
  • Existing power plants
  • EV charging stations
  • Large industrial consumers (EEA registry)

Exclusion zones

  • Environmental and socio-economic zoning (MITECO)
  • PV sensitivity index
  • Protected landscapes
  • Aeronautical and radio easements, aerodromes

Projects

  • Existing wind turbines
  • Projects under permitting
  • Prospective areas

Cadastre and territory

  • Administrative units
  • Cadastral parcels and land use
  • 5 m digital elevation model
  • Land registry extract request

Market

  • Hourly day-ahead market prices for the financial model
  • Reference CAPEX and OPEX by technology

Plus your own layers on the same map: vector (GeoJSON, KML/KMZ, GPX, Shapefile), raster (GeoTIFF and Cloud Optimized GeoTIFF), delimited text (CSV or TXT with X/Y or WKT), WMS/WMTS and WFS services, and XYZ tiles.

Pricing

Start for free. Real estate agencies work with the Agency plan; developers and consultancies with WindSense Pro. All plans are month to month, with no minimum term.

To get started

Free

€0
No sign-up, no card
  • Express check at any point in Spain: wind at 150 m, distance to grid, environmental sensitivity, nearby turbines and landscape
  • Each value next to its suitability threshold
  • Agencies: a check of 10 plots from your portfolio, suitable or not and why
Open the free map
Real estate agencies

Agency

€99/month + VAT
First 10 agencies: €49/month for 12 months
  • Map with every layer and substation capacity updated monthly
  • Your own layers: Shapefile, GeoJSON, KML, GeoTIFF, CSV, WMS/WFS
  • AI land search
  • Cadastre and express check for each parcel
  • Owner tracking and reports per plot and per negotiation
  • Your data on your computer, backed up to your Google Drive
Request access
Coming soon

Agency + Market

€199/month + VAT
The whole Agency plan, plus market data:
  • Rural land listed for sale and for rent over the last 6 months, with price per hectare
  • An alert for every new listing near substations with capacity
  • Comparable offers in each plot report
Join the list
Developers and consultancies

WindSense Pro

€490/month + VAT
The whole Agency plan, plus:
  • Turbine and module layout, with yield and capacity factor
  • Financial evaluation: LCOE, IRR, NPV and maximum land rent
  • Drawings, financial report and EIA structure
  • KML and spreadsheet export
  • Market data included once it goes live
Request access

Prices exclude VAT. Need something else: a single-site report prepared by our team, several users, annual billing with two months free or a success-fee partnership? Contact sales. Invoiced by Terra Eolica Soluciones S.L. Conditions in the terms of use.

See a real report before you decide

We will email you a real, anonymised single-site report as a PDF: the one our team prepares for a client.

Get the sample report

Frequently asked questions

Where does the data come from?

From official public sources: MITECO environmental zoning and sensitivity index, connection capacity published by Red Eléctrica and the distribution companies, which we update every month, the Spanish Cadastre and the national digital elevation model, OMIE hourly day-ahead prices, the European EEA industrial registry, OpenStreetMap infrastructure and a wind atlas at 150 m height. Each value is shown with its source so you can check it.

Does it work for solar and storage, or only wind?

For all of them: wind, PV, hybrids and battery (BESS) configurations. Grid, zoning and cadastre screening is common to all; the express check, the layout and the financial model adjust to the plant type you select.

Does it replace a measurement campaign or windPRO?

No. WindSense is a screening and pre-feasibility tool: it helps you decide which sites are worth spending money on measurements, studies and negotiation. Detailed design is still done in windPRO, WAsP or whatever your team uses, starting from the exported KML.

Can I take the results into QGIS or Excel?

Yes. The site and the layout export as KML, which opens in QGIS and Google Earth. Hourly series, yearly indicators and the assumptions of the financial report are delivered in spreadsheet format. It also works the other way: your own layers (Shapefile, GeoJSON, KML, GeoTIFF, CSV) and the WMS/WFS services you already use load onto the WindSense map.

Is there a minimum term?

No. The Agency and Pro plans are billed month by month and can be cancelled at any time. Annual billing, with two months free, is arranged with sales.

I am a real estate agent: what exactly do I get?

The Agency plan: the map with the layers developers look at, including substation capacity updated every month; your own layers; AI land search; cadastral data and the express check for each parcel; tracking of every owner; and reports per plot and per negotiation. You can start with a free check of 10 plots from your portfolio.

Where are my plots and owners stored?

In a database on your computer, not on our servers. Backups go to your own Google Drive.

Will you contact my owners?

No. We do not contact your owners or your buyers without you. If you publish a plot in our land portfolio and the buyer or tenant comes through our network, we split your fee 50/50; the owner pays nothing extra.

What does the Agency + Market plan include?

Rural land listed for sale and for rent on property portals over the last six months, with price per hectare; alerts for new listings near substations with capacity; and comparable offers in each plot report. The module is in preparation: join the list and we will let you know when it goes live. Listing prices are asking prices, not closing prices.

Terra Eólica – independent and trusted advisory in renewable energy